Recent Enhancements for Labor Analytics Dashboard
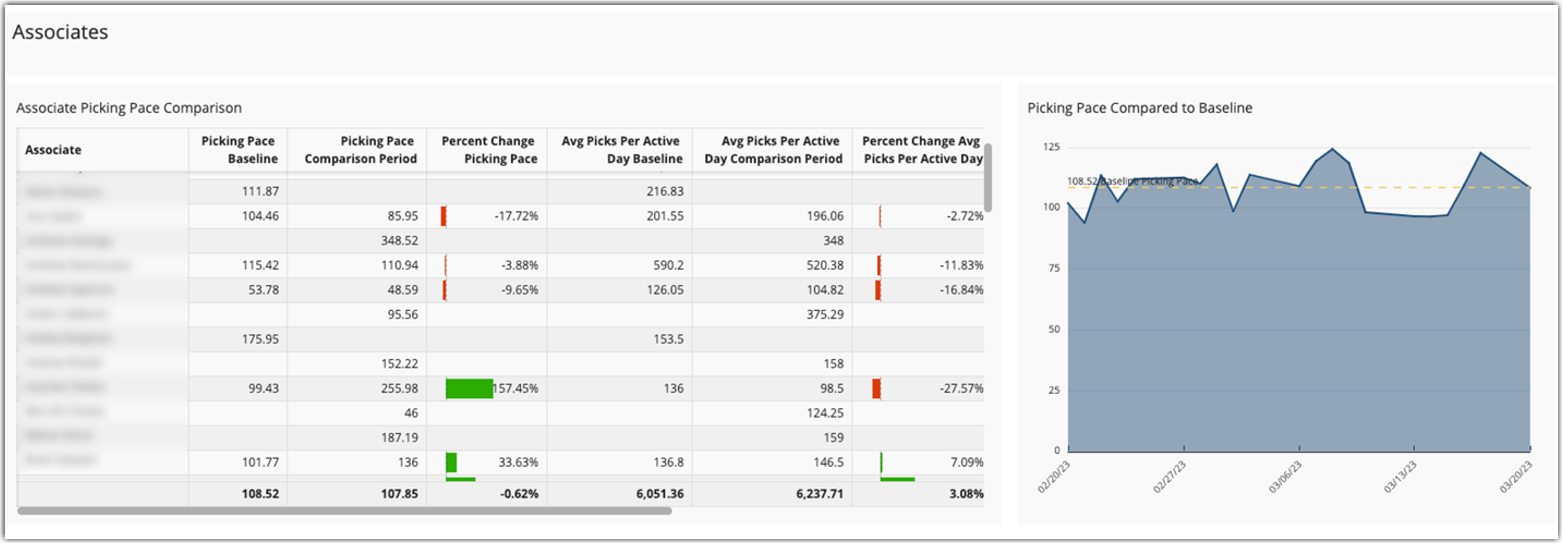
The new Results sheet measures productivity improvements by warehouse, associate, and customer.
This feature enables you to set a baseline date range and a comparison date range and then it shows productivity increases or decreases between those periods.

Today’s data visuals are now based on near real-time data.
Previously there was an hour delay but now, today’s picking and packing productivity visuals are based on near-real-time data.
Picking details now include Item SKU, Description, and Primary Quantity columns.
These additional columns enable you to see the full picture of a pick job – who picked the job, how long did it take to pick specific items and quantities. This data is accessed by right-clicking on the horizontal bar corresponding with an associate or by right-clicking on their name in any table and you will be linked to that data in the Details sheet. You can also go directly to the details sheet and enter a Transaction ID, Pick Job ID, or associate name to see details.

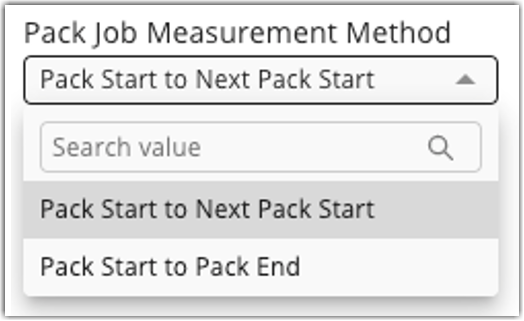
New Packing Productivity Measurement method – Pack Start to Next Pack Start.
Previously, we only measured packing time from the point at which the Pack and Ship dialog was opened to when the user clicked pack and ship. What we learned through customer feedback is that many warehouses have workflows that include packing steps that go beyond clicking the Pack and Ship button. This new method measures total pack time based on a Pack Start event to the Next Pack Start event. For some customers, this is a much more accurate way of measuring total pack time and all the derivative KPIs. This filter setting automatically updates charts and tables on the Packing Productivity, Customer, and Details sheets.

Now you can filter Labor Analytics by the Carrier and Order Source associated with the orders. They may help differentiate productivity between B2B and B2C orders.


