Understanding the Warehouse Productivity Dashboard
Overview
The Warehouse Productivity Dashboard enables warehouse managers with operational insights about the fulfillment workload, fulfillment status, and workflow productivity for orders being fulfilled in the current workday.
This article reviews how to configure and interpret the Warehouse Productivity Dashboard.
To access this dashboard, you must have a Professional or Enterprise subscription and have the following permission assigned to your user role: Data Insights Module > Operations Dashboard > Warehouse Productivity.
Currently, this dashboard cannot be viewed by customer users. A future add-on product will include the ability to share access to dashboards with customers.
How to access
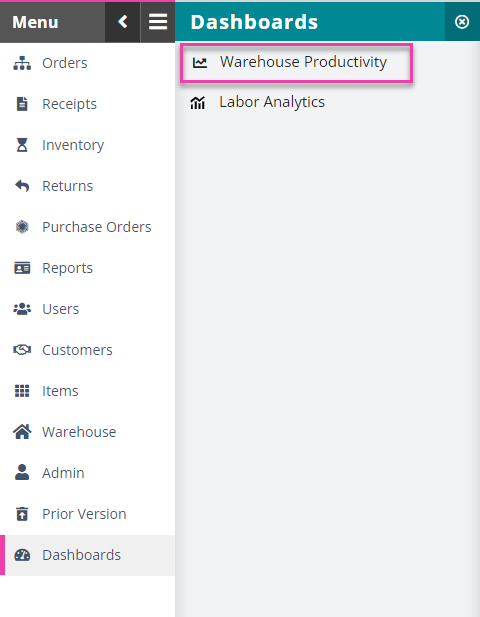
Once your account is activated for the beta, you can access the Warehouse Productivity Dashboard through the left navigation menu via Dashboards > Warehouse Productivity.
How it works
Data from your 3PL Warehouse Manager database moves through a pipeline to a data warehouse, which is accessed by the Warehouse Productivity Dashboard. While visuals that require near real-time data use a faster sync process with a delay of typically between 5 and 15 minutes, hourly and historical data visuals use data that is delayed by about one hour. Dashboard data is near real-time unless otherwise indicated with a “◴” symbol.
For more information on data sync delays, see Understanding Dashboard Sync Time.
What the data visuals look like
Summary of the various sheets
Like spreadsheets, our new dashboards can have multiple sheets or tabs. The Warehouse Productivity Dashboard currently has four sheets: Summary, Receiving Status, Fulfillment Status, and Productivity.

Each of these sheets contains visuals, which have a title and corresponding chart or table—each visual is explained in detail in the sub-sections below.
Before we dive into each sheet, it's important to understand the filters that refine the dashboard data:
- Currently, filters only list warehouses and customers related to active orders in 3PL Warehouse Manager. For example, customers with no Open or Complete orders do not appear in the filter list.
-
Expandable filters in the "Controls" section at the top of each sheet enable you to identify the set of pending orders you would like to track in the dashboard and vary slightly in each sheet. Simply click within the Controls section to edit these filters.

- Some visuals enable you to click on a chart element and filter by the element—these are called action filters. Examples include Age of Allocated Orders, Orders by Carrier, and Orders by Fulfillment Status. Just click the chart element a second time to end action filtering.
Most of the filters are self-explanatory and consistent with the Find Orders page in 3PL Warehouse Manager. The following filters are unique to the Warehouse Productivity Dashboard:
- The Start of Day, Order Cutoff, and Fulfillment Cutoff filters enable you to set times for your warehouse operations. If you have multiple warehouses spread across time zones, these filters will only be accurate if you filter warehouses to those in the same time zone.
- Note that the Carrier filter only shows the carriers in the filtered order set.
- Earliest Ship Date is a relative date filter. The “0” value corresponds with the current day, negative values correspond with previous days, and positive values correspond with future days.
Summary Sheet
The visuals in the Summary sheet provide a summary of how you started the day, give you a picture of the current day's workload, and display the current number of closed and outstanding orders.
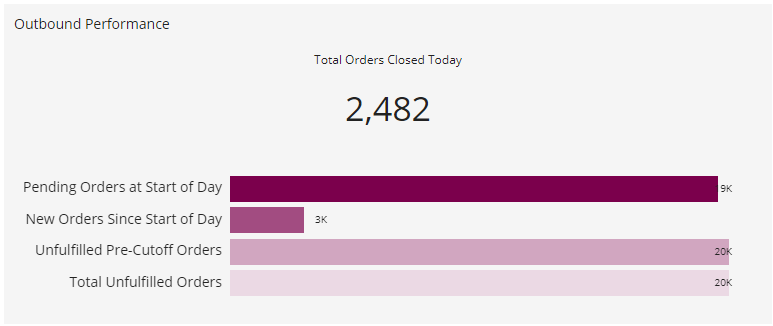
- The top row of metrics requires you to set your Start of Day, Order Cutoff time, and Fulfillment Cutoff time in the filters.

-
Pending Orders at Start of Day is measured based on the Start of Day parameter.
-
New Orders Since Start of Day is the number of new orders with an Open or Complete status before the configured Order Cutoff time.
-
Unfulfilled Pre-Cutoff Orders are the un-closed orders that were Open or Complete before the configured Order Cutoff time (as opposed to all Open or Complete orders).
-
Pending Orders at Start of Day is measured based on the Start of Day parameter.
-
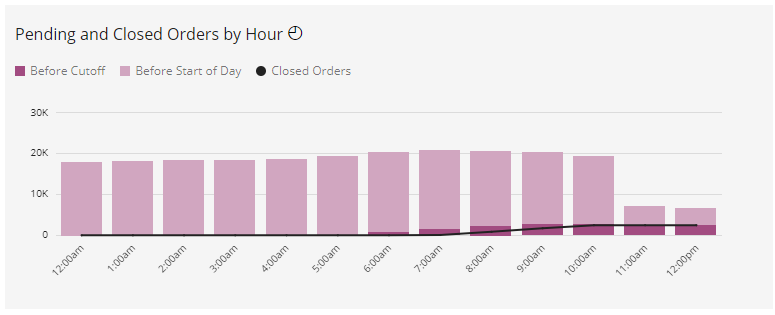
Pending and Closed Orders by Hour shows the number of orders in pending and closed states by hour.
-
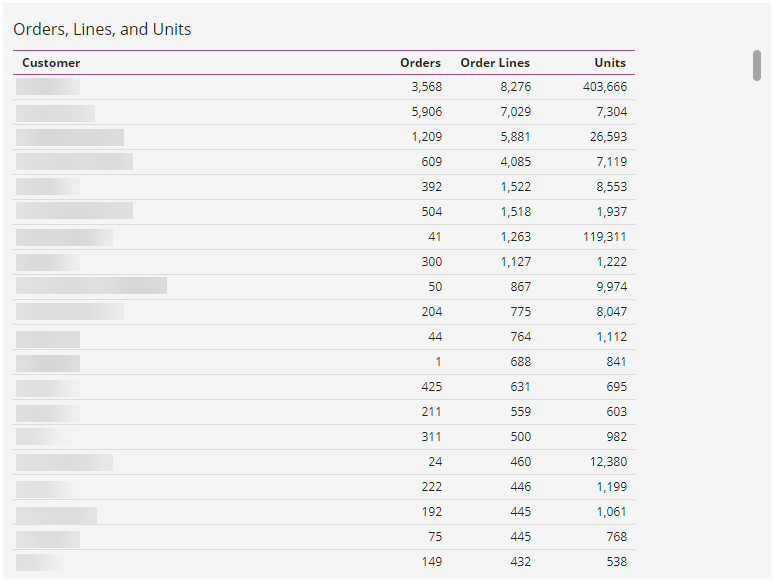
Orders, Lines, and Units provides a view of orders, order lines, and units by customer. You can click on the table to change the sort order or export the table.
-
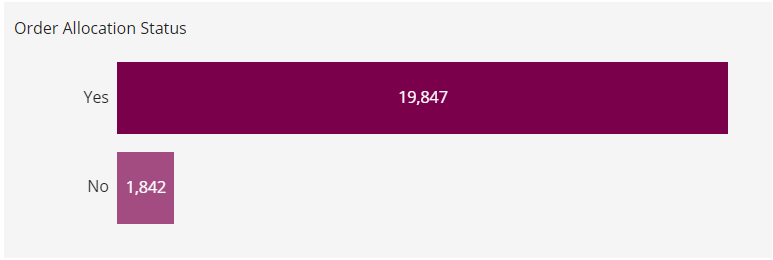
Order Allocation Status shows the allocation status of the orders in the current filtered set—"Yes" indicates the number of orders that are fully allocated, while "No" indicates the number of orders that are partially allocated or unallocated. This is based on data with a 1-hour delay.
-
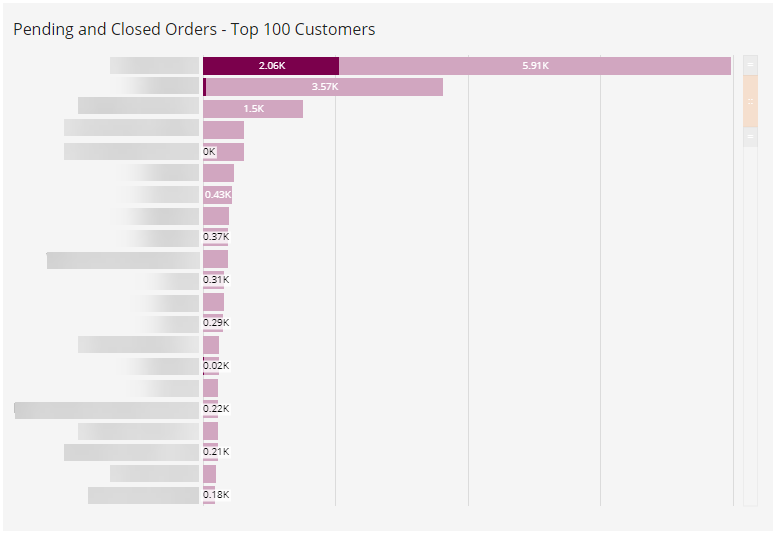
Pending and Closed Orders – Top 100 Customers shows the number of pending and closed orders organized by your top 100 customers.
-
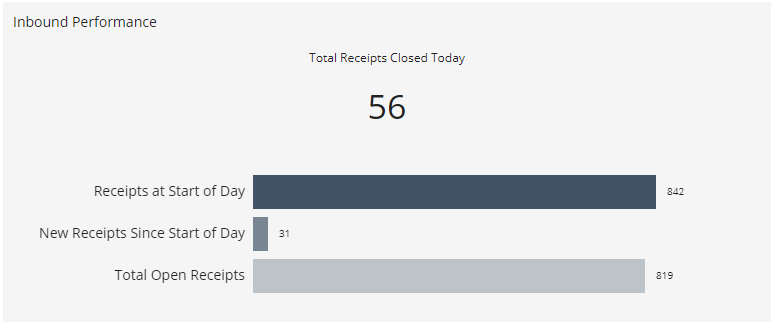
Total Receipts Closed Today shows the total number of receipt transactions closed today.
-
Receipts at Start of Day shows the number of open receipts at the start of the day based on the sheet’s Start of Day filter setting.
-
New Receipts Since Start of Day shows new receipts in an open status since the Start of Day as set in the sheet filters.
-
Total Open Receipts shows the total number of open receipts.
-
Receipts at Start of Day shows the number of open receipts at the start of the day based on the sheet’s Start of Day filter setting.
-
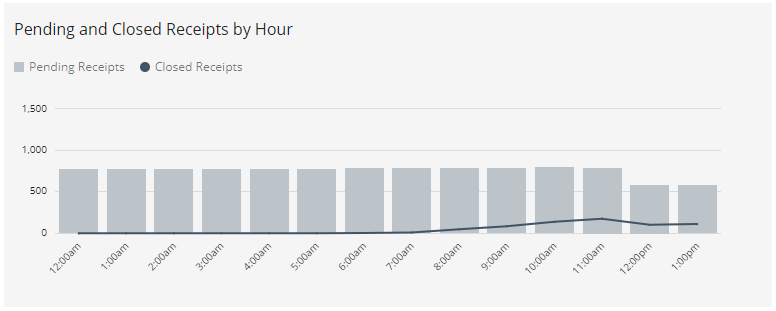
Pending and Closed Receipts by Hour shows the number of receipts in pending and closed states by hour.
-
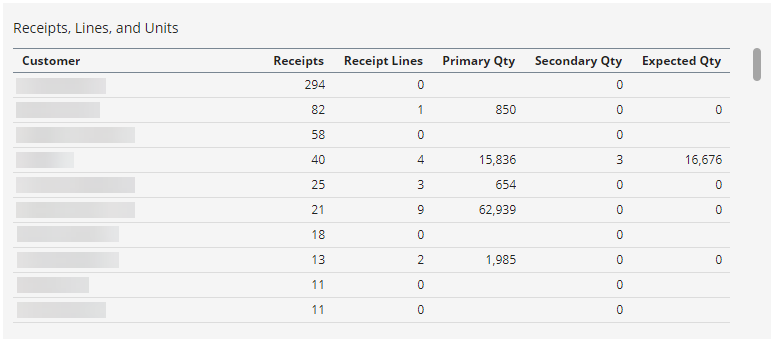
Receipts, Lines, Units shows the number of receipts, receipt lines, and units by customer.
-
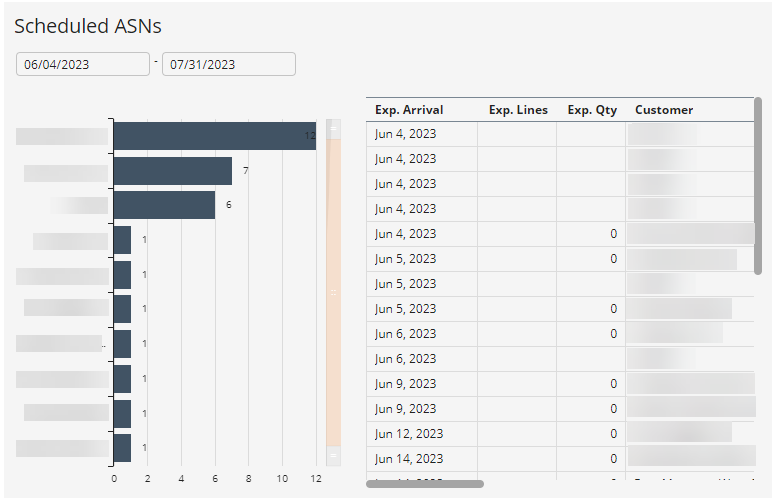
Scheduled ASNs is a table of scheduled ASNs with details. This visual includes a date range filter.
-
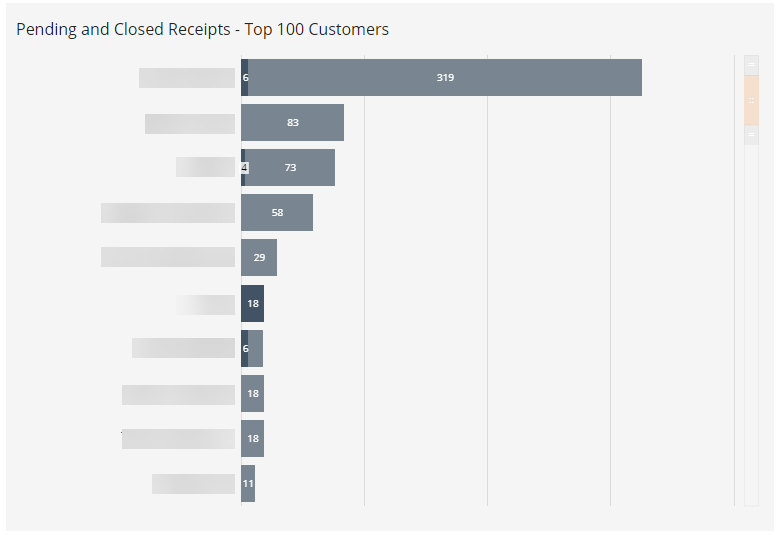
Pending and Closed Receipts — Top 100 Customers shows receipt pending and closed statuses by customer.
Receiving Status Sheet
The visuals in this sheet show an overview of the various statuses of your receipts.
- Orders by Receiving Status provides the count of receipts in the following states:
- Incomplete ASN ASNs that have not been fully defined and which customers are still able to edit.
- Complete ASN fully defined ASN that customers do not have the ability to change.
- Receipt Pending – A receipt has been created or an ASN arrived but receiving has not yet started.
- Receiving – Receiving is in progress.
- Received – All receipt lines have been processed.
- Closed - The Receipt Transaction is confirmed.
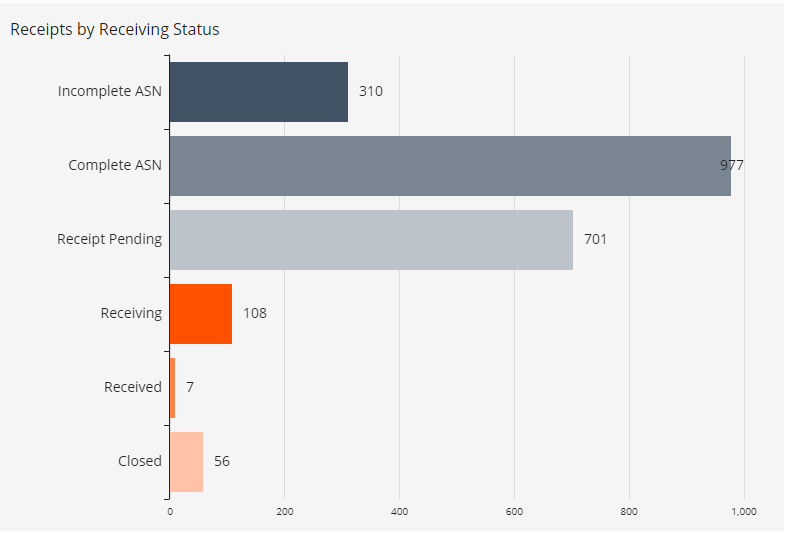
You can filter the Arrived Receipts Status Details table by clicking on any status bar. Click on the bar again to clear the filter.
-
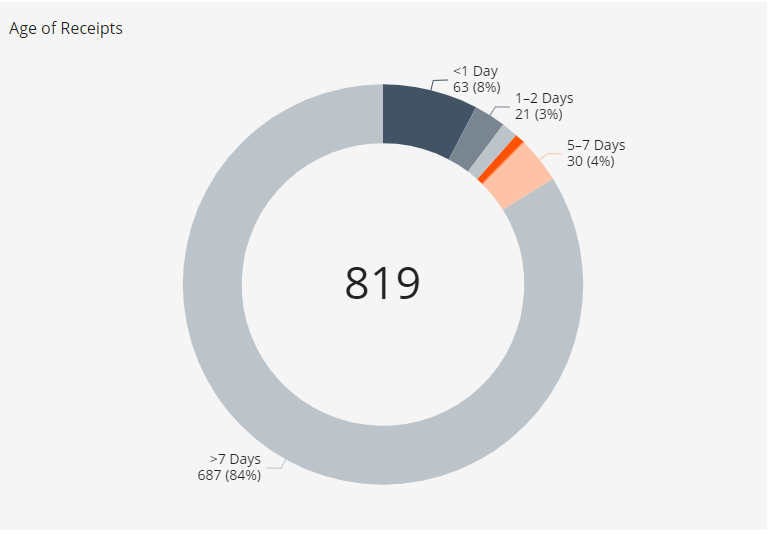
Age of Receipts provides a count of receipts within age ranges. The age clock starts when the receipt has arrived or been created and is ready to be received.
-
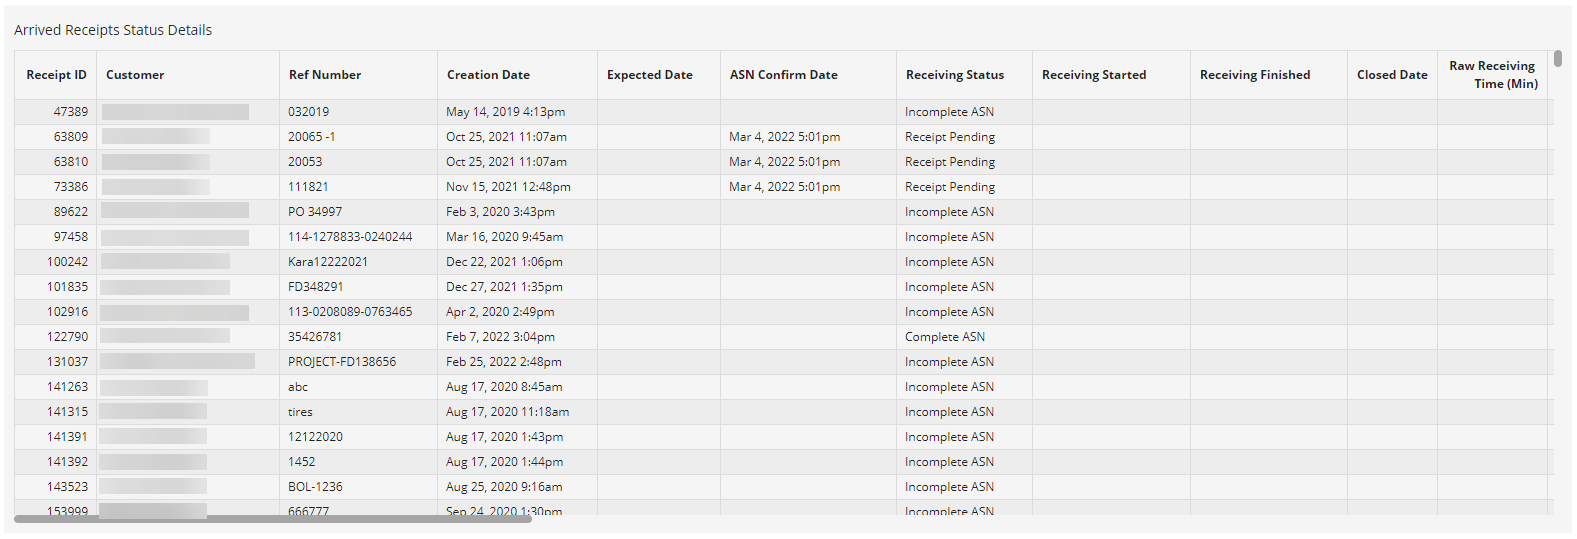
Arrived Receipts Status Details provides details for each receipt. Scroll to the right to see all the columns.
-
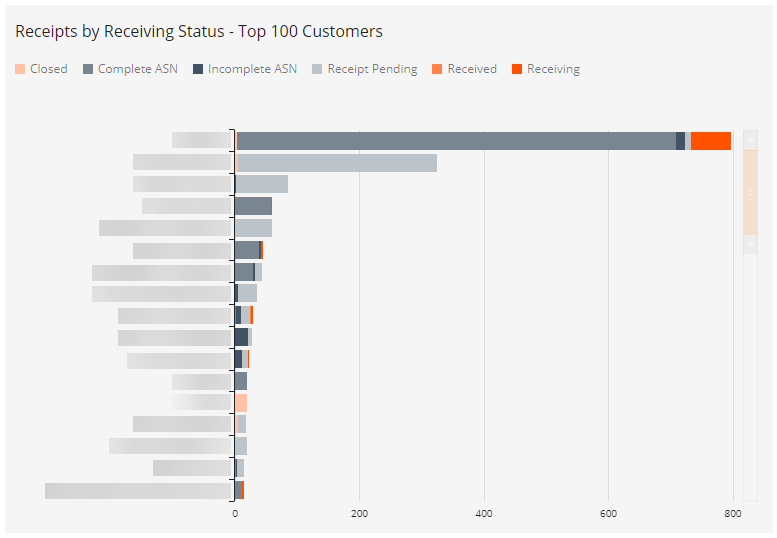
Receipts by Receiving Status — Top 100 Customers provides details for each receipt. Scroll to the right to see all the columns.
Fulfillment Status Sheet
The Fulfillment Activity sheet provides a near real-time view of order fulfillment that is in progress. It provides a comprehensive picture of how many orders are in various workflow stages and the ability to filter for further details.
-
The Orders by Fulfillment Status visual shows the number of orders in various fulfillment states. This visual relies on event timestamps that come from 3PL Warehouse Manager events (Pick Ticket Printed, Closed), SmartScan (Picking, Picked, Packing, Packed, Load Complete), and Small Parcel Suite (Packing, Packed, Shipped). The chart shows the number of orders in the latest stage of the fulfillment workflow. For example, the number of orders in a Picking state represents orders that have had at least one line item picked but have not been fully picked.
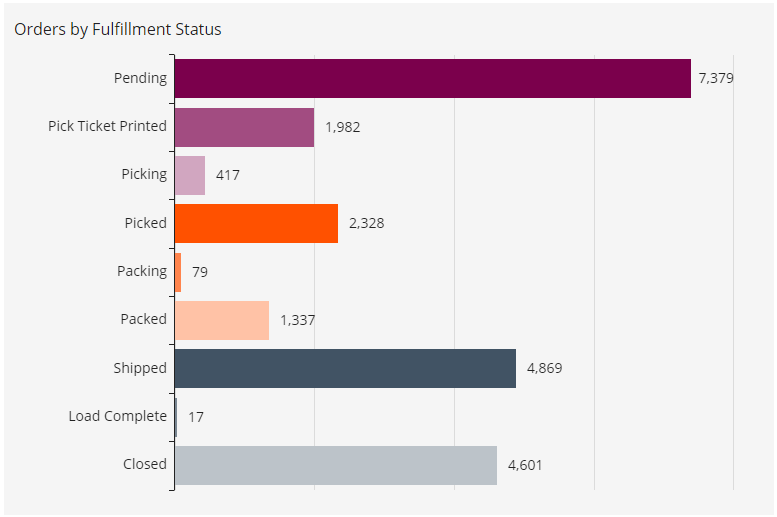
To filter the visual, simply click on an individual status in the chart. Click a second time to end the filtering.
-
Age of Allocated Orders is calculated from allocation date/time. Click a segment of the donut chart to filter the Allocated Order Status Details table. This is based on data with a 1-hour delay.
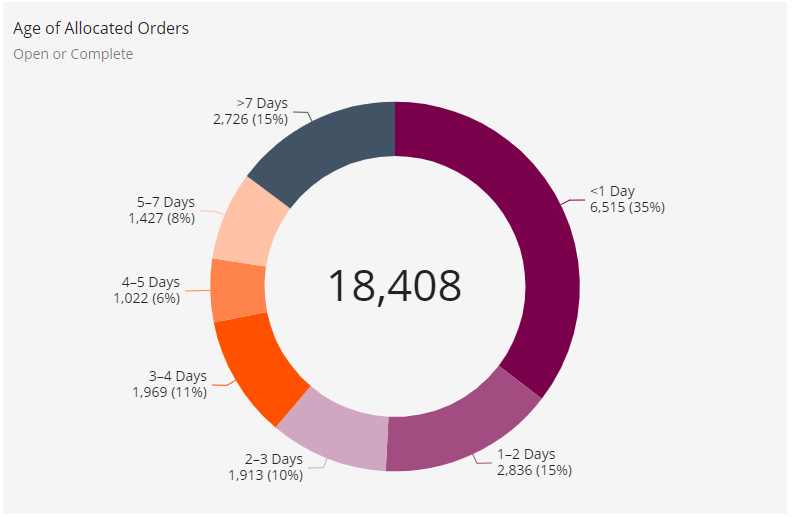
- The Order Status Details table shows more information on each order, including the picking status, pick owner, and packing status. Click within the table to scroll vertically and horizontally, sort by column, or export.

-
Orders by Carrier shows the number of orders associated with each carrier. Hover over the smaller donut chart segments to view the number. Click on a donut chart segment to filter the Allocated Order Status Details table by that carrier.
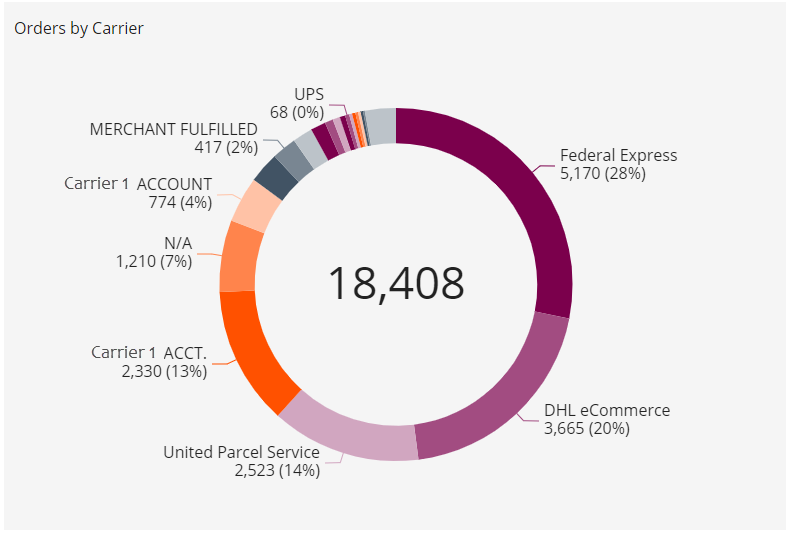
-
Orders by Fulfillment Status – Top 100 Customers shows fulfillment status by an individual customer. Use the scroll bar on the right to scroll down or drag the handle on the bottom of the scroll button to fit more customers into the chart.
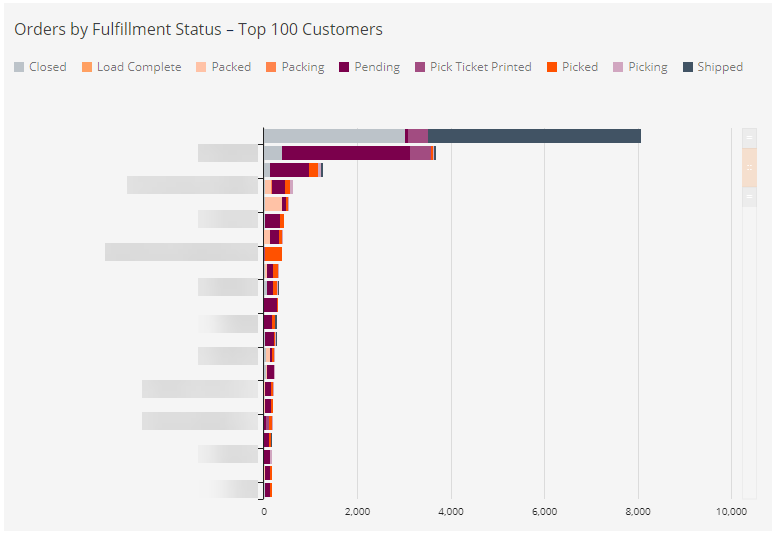
-
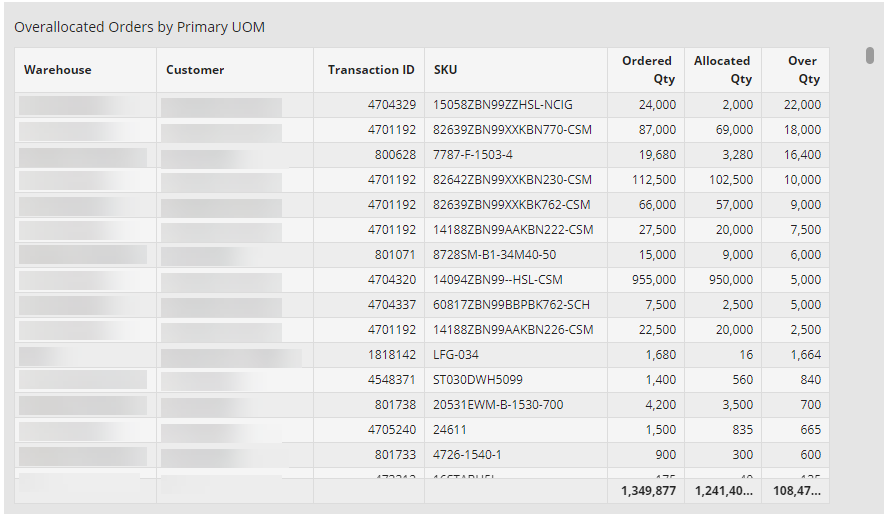
Overallocated Orders by Customer and Overallocated Orders by Primary UOM enable you to view the number of overallocated orders by customer and then click on a horizontal bar to filter the Overallocated Order details table by that customer. These visuals also include filters for Status, Transaction ID, and SKU.

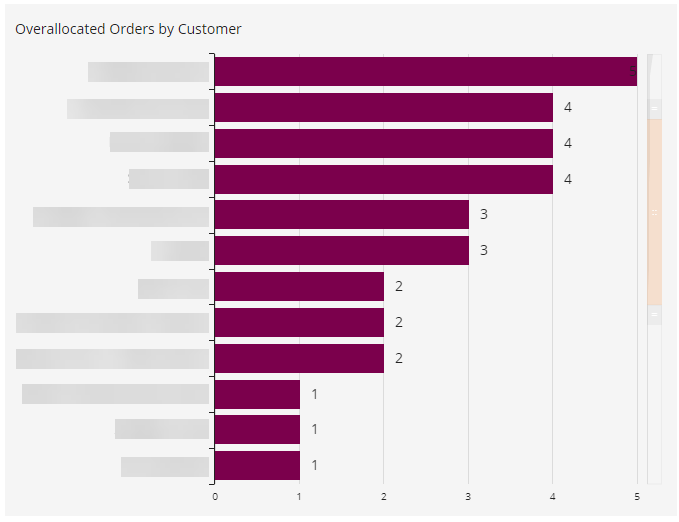
Productivity Sheet
The Productivity sheet provides productivity indicators for the current day and the past seven days. The filters on this sheet include the Start of Day, Order Cutoff, and Fulfillment Cutoff, as well as a Picking Pace Goal filter.
-
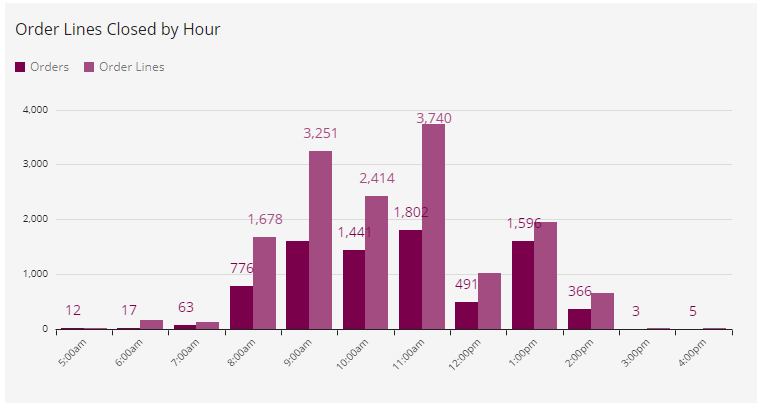
Order Lines Closed by Hour shows both orders and order lines closed by hour. This is based on data with a 1-hour delay.
-
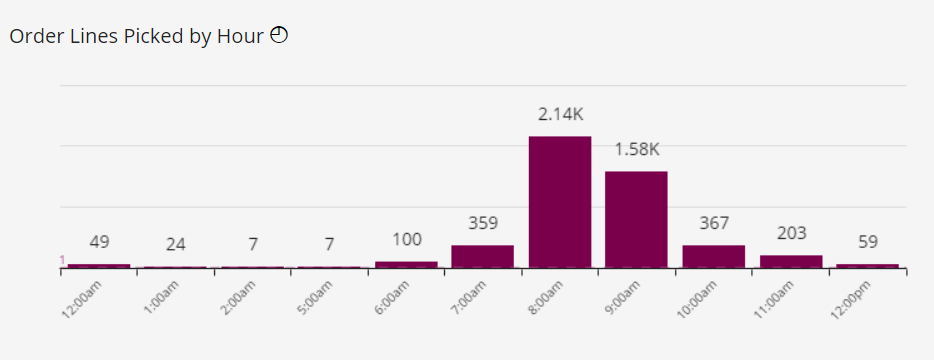
Order Lines Picked by Hour uses event data from SmartScan to show the number of pick jobs completed each hour. This is based on data with a 1-hour delay.
-
Order Lines Picked—Last Hour uses near-real-time data to show picking pace in the last hour.

- The Picking Pace Goal filter determines the placement of the hourly goal bar and the goal indicator in the last-hour gauge.

- The Picking Pace Goal filter determines the placement of the hourly goal bar and the goal indicator in the last-hour gauge.
-
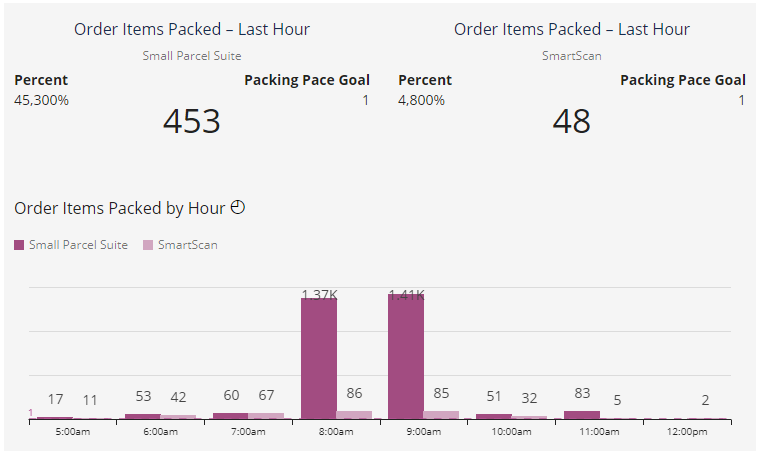
Order Items Packed by Hour shows the total number of order items packed each hour.
-
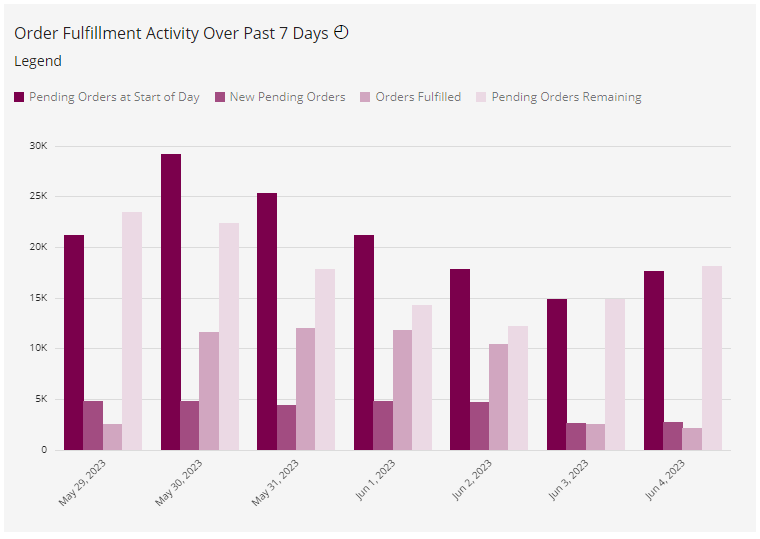
Order Fulfillment Activity Over Past 7 Days provides an at-a-glance view of activity each day. This is based on data with a 1-hour delay.
-
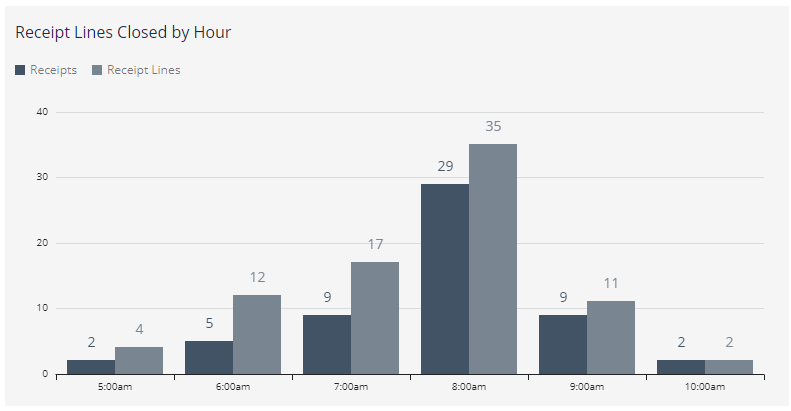
Receipt Lines Closed by Hour shows the number of Receipt Transactions and Receipt Lines closed by hour.
Warehouse Productivity Dashboard FAQs
For more information, you can visit this article for common FAQs for Warehouse Productivity Dashboard
