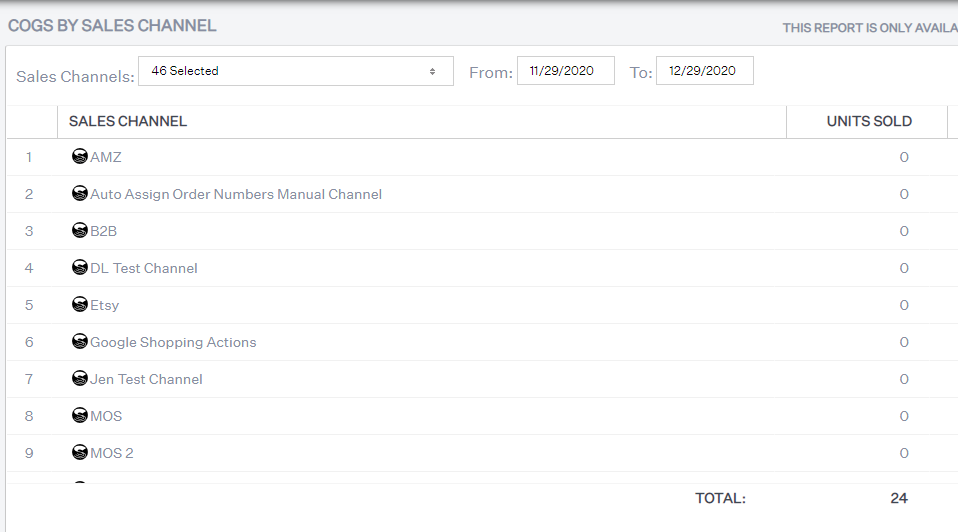
Analytics - COGS By Sales Channel
What does this report reveal?
This Extensiv Order Manager report reveals your COGS with the amount of units sold per sales channel over a specified period of time.
How to read this report?
To read this report, select your sales channels and the date range you wish to find your product costs per channel. Each unit sold contributes to your COGS, so a high cost with low units sold should be investigated to allow price increases for certain products and influence a better margin.
What actions to take after analyzing this report?
After your analysis, you can take your COGS data and compare it to your sales summary totals to understand how much of a chunk your costs has taken out of your revenue. This should help you decide if you are comfortable with your true profits or if your costs are too high for any sort of profit. Thus, you should decide to either liquidate or reprice.
How do we calculate COGS?
For example an order came in on APRIL 2022 but was shipped on MAY 2022, that order will still be recorded under the APRIL filters. The COGS will be recorded during the month the order got shipped. If you run the reports with orders still not in a shipped status for a particular month, the COGS value for that month will only get updated (or increase) when those orders get shipped.
How to export this report?
This report is exportable in Microsoft Excel format. For instructions, see Exporting Reports.

