Analytics - Trending Inventory Value
What does this report reveal?
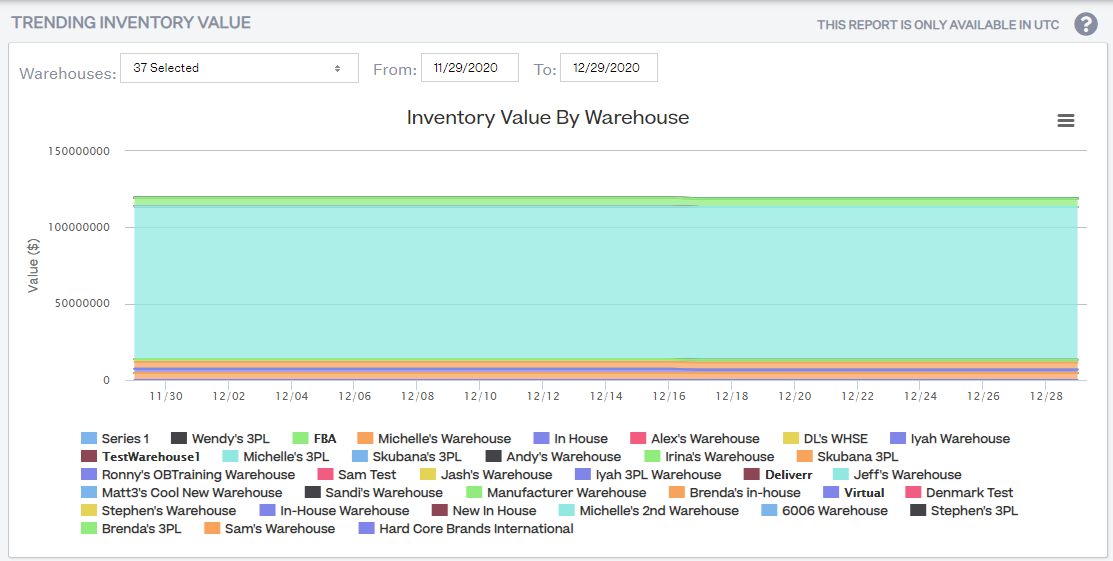
This report reveals the total inventory value in all your warehouses, any combination of your warehouses, or in each individual warehouse and compares the volume of inventory in each warehouse over a given date range.

How to read this report?
This report identifies each warehouse’s inventory value with an assigned color, easing identification of your warehouses with the most inventory. Hovering with the mouse over each date identifies the inventory value in your warehouses over the given period, allowing you to identify trending inventory value data.
What actions to take after analyzing this report?
After your analysis, you should be able to identify how much revenue is located at each location. If you have high inventory value sitting in specific warehouses, you should check to ensure that your products are moving so as not to incur extra fees. You should also take steps to prevent long term sitting fees in your sales channels.
How can this report be exported:
This report can be downloaded as an image or PDF by clicking on the hamburger menu at the right-hand corner of the graph.
